Model Studies – Actual status
Most important for prognostic model studies is their validation
on the basis of the actual status in nature. The model is
controlled by the actual meteorological boundary conditions,
by the actual bathymetry and the in and out flowing water
masses.
One of the major results of
the simulation model is the
current pattern which for example can be validated by current
measurements. Currents resulting
from model studies depend strongly
on the governing boundary conditions i.e. the bathymetry,
the wind and the in and out
flow. Differences between measurements
and model results in general are caused by wrong assumptions
regarding the
boundary conditions.
 |
Figure:
Surface
current pattern calculated
with westerly
winds and in
and outflow volumes of 1
m³/s
|
Additionally
to the simulation of the
basic actual status the
current pattern was calculated
for an in flow volume which is typical
for the summer season.
This typical summer in
flow was derived from daily
records of the in flow volume of the last 10
years. For the time period
from June to September
a mean in flow of 1.6 m³/s was calculated.
Figure: Daily mean in flow
volumes calculated from
culvert records from 1996
to 2006
|
 |
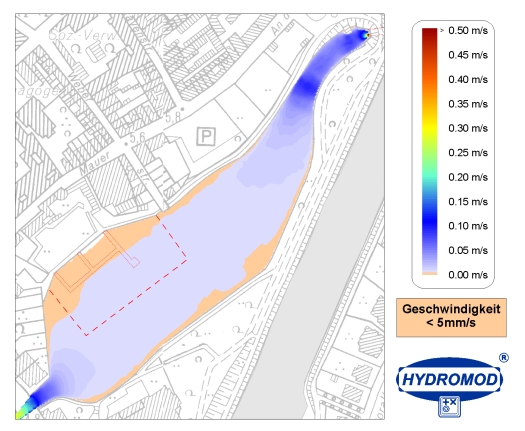
Model results based on the summer in flow volume (1.6 m3/s) clearly
show very weak current velocities
in the area of the swimming bath. That means that the residence
time of for example contaminated
water is very high at this place.
|
| Figure: Model
results of the currents with
weak wind forces and a typical
summer inflow of 1.6 m³/s. |
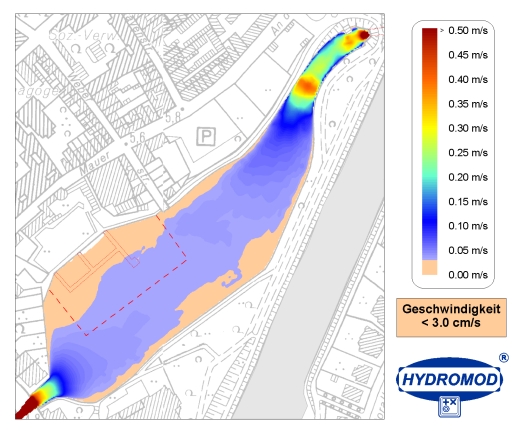
In order to improve the hydrodynamic situation (decrease of residence
time) within the Krähenteich two different approaches were
studied. The first approach, a
short-term increase of the in flow
volume modifies the current regime
in the lake substantially. It causes
a pronounced decrease of the residence time within the area
of the swimming bath. This scenario
was calculated with an in flow
volume of 7.1 m³/s.
|
| Figure: Model
results of the currents with
weak wind forces and a maximum
in flow of 7.1 m³/s. |
Due to the fact that during summer time in general only low precipitation
(rainfall) can be expected the
water capacity for flushing the Krähenteich is limited. For
that reason it is important to study the flushing time necessary
to cause a substantial removal
of contaminated water within the
swimming area. The following model studies were focused on different
flushing scenarios as well as
on a more technical approach (training
wall).
Model Studies
Studying the impact of selected technical measures to control and
improve the flushing capabilities
of the currents within the target
area, the wind and its driving forces were not considered. This
assumption provides a good approach
for the summer season, when considerable
wind velocities are rather rare in the target area
and therefore mixing forced by
wind is almost neglectible.
|
|
 |
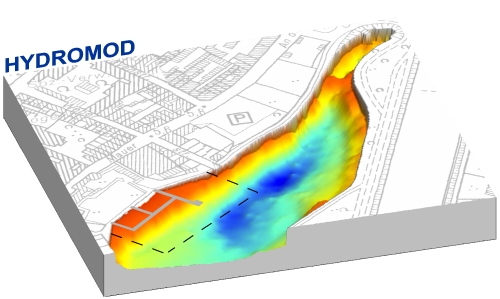
Figure: Actual
bathymetry of the Krähenteich
without training wall. |
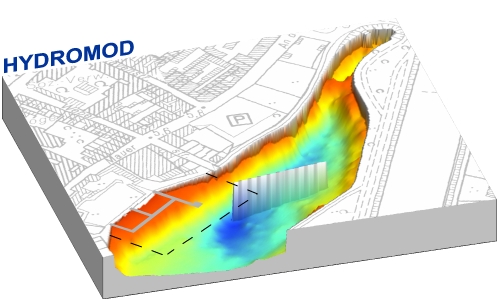
Figure: Actual
bathymetry of the Krähenteich
with training wall. |
 |
 |
| Figure: Model
results (current pattern) with
a maximum flushing (7.1 m³/s). |
Figure: Model
results (current pattern) with
a maximum flushing (7.1 m³/s)
plus training wall.
|
|
Based on the model results (3-dimensional current pattern) the
residence time was calculated with different tracer scenarios.
With this approach a number of different water bodies (e.g. the
swimming bath area) within the Krähenteich were marked with
tracers of different colour. Due to this approach it is possible
to follow the path ways (i.e. the spreading) of these different
water bodies. |
 |
 |
 |
 |
Figure (up): Tracer
scenario without training wall
(time step 15 min.).
Figure (down): Vertical tracer distribution
within Krähenteich and swimming bath area (time step
15 min.). |
Figure (up): Tracer
scenario with training wall
(time step 15 min.).
Figure (down): Vertical tracer distribution
within Krähenteich and swimming bath area (time step 15
min.).
|
|
The statistical evaluation of the tracer’s spreading
provides exact information on the residence time of the different
water bodies. For the entire Krähenteich a number of 136.300
tracers were regularly distributed over the water body. For
the water body of the swimming bath area a number of 28.100
tracers were necessary. |
 |
 |
| Figure: Evaluation
of the tracer study (residence
time) without training wall. |
Figure: Evaluation
of the tracer study (residence
time) with training wall. |
|
Additionally to the information on the residence time of the
waters within the swimming bath area the tracer studies provided
also information on the residence time within the entire Krähenteich.
|
 |
 |
| Figure: Residence
time within the Krähenteich without training wall. |
Figure: Residence
time within the Kr ähenteich with training wall. |
next ...